
One of the lures that originally attracted me to digital marketing was the ability to measure the impact of your work.
Perhaps an initial training as a chartered accountant is to blame, but I relished the ability to analyse performance using numbers that do not lie. I really enjoyed the creativity of marketing but was frustrated by fluffy metrics such as advertiser value equivalency (AVE), so loved by the PR industry, as they felt vague and, in some cases, fraudulent. Digital marketing felt much more black and white and offered a far greater opportunity to truly analyse performance at a very granular level.
I do, however, sometimes feel that the digital marketing industry has created a rod for its own back and that the numbers can sometimes lie. Mark Twain was not wrong when he famously said, “There are three kinds of lies: lies, damned lies, and statistics.” Data can be manipulated to create a story and it is vital to scrutinise the numbers and assess what they are really saying.
It is equally important to avoid vanity metrics. It is easy to convince yourself that everything is good if you can see your website traffic growing, but how much time do you spend analysing the quality of that traffic? In my humble opinion, quality really is more important than quantity in almost all aspects of digital marketing.
But how do you measure the quality of your web traffic?
There are actually many ways to analyse quality, but they should all be considered as barometers rather than thermometers. You should try to use as many indicators as possible and, crucially, think about the intent of a user arriving on your site. If they are looking for your phone number, a high bounce rate or very short time on site metric would be a good thing, as they obviously found your number without having to trawl through the site looking for it. Most people worry about high bounce rates, but there are scenarios where you want it to be low and you should certainly not obsess about it – use it as one of the metrics you consider.
Scroll Depth Analysis
I would expect most people to be familiar with metrics such as bounce rate, pages/visit or avg. visit duration. All are readily available in Google Analytics and they do help give an indication of how engaged your users are. There are, of course, scenarios which can trip this data (e.g. a user leaving a page open for hours in a browser window whilst doing something else), but an average value is useful and I would absolutely encourage you to look at this data.
A less well-known approach is to analyse scroll behaviour. Rather than looking at how long a user remains on a page, it is arguable more revealing to analyse how much of a page is actually viewed. I think this is especially true of blog content – it is very interesting to explore scrolling behaviour across different blog content to get a feel for which posts were the most successful.
Although a little more fiddly to set up, it is not hard to do and is an interesting test to do if you want more detail on how users are engaging with your site. You can track both vertical and horizontal scrolling, but for the purposes of this post I am going to look at vertical scrolling as this is the best indicator of how far down a page a user progressed.
I am also going to show how to do it in Google Tag Manager, as this is by far the easiest way to do it on a budget (free) and you should really be using a platform like Google Tag Manager if you want to get the most from your analytics.
Set Up
I will assume a basic knowledge of Google Tag Manager in these steps, but setting up scroll depth analysis is well within the reach of even the most basic tag manager users. I will break it down into simple steps:
Scroll Depth Variable
The first thing you will need to do is set up a scroll depth variable. This is actually built in to Google Tag Manager but is not enabled by default. If you select ‘Variables’ in the left hand menu on the homescreen and then click on the blue ‘Configure’ button, you will see a list of all inbuilt variables. Look for the ‘Scrolling’ section and tick all three boxes:
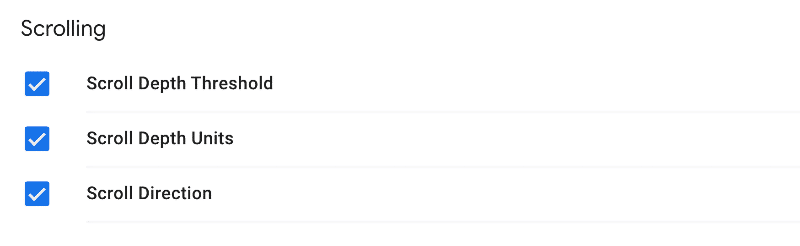
That is all you need to do.
Create Tag
The next step is to create a tag. Select ‘Tags’ from the left hand menu and click on the blue ‘New’ button to launch the new tag configurator. I set our tag using Universal Analytics rather than GA4 (Vic explains why you don’t have to use GA4), so the settings are as follow:
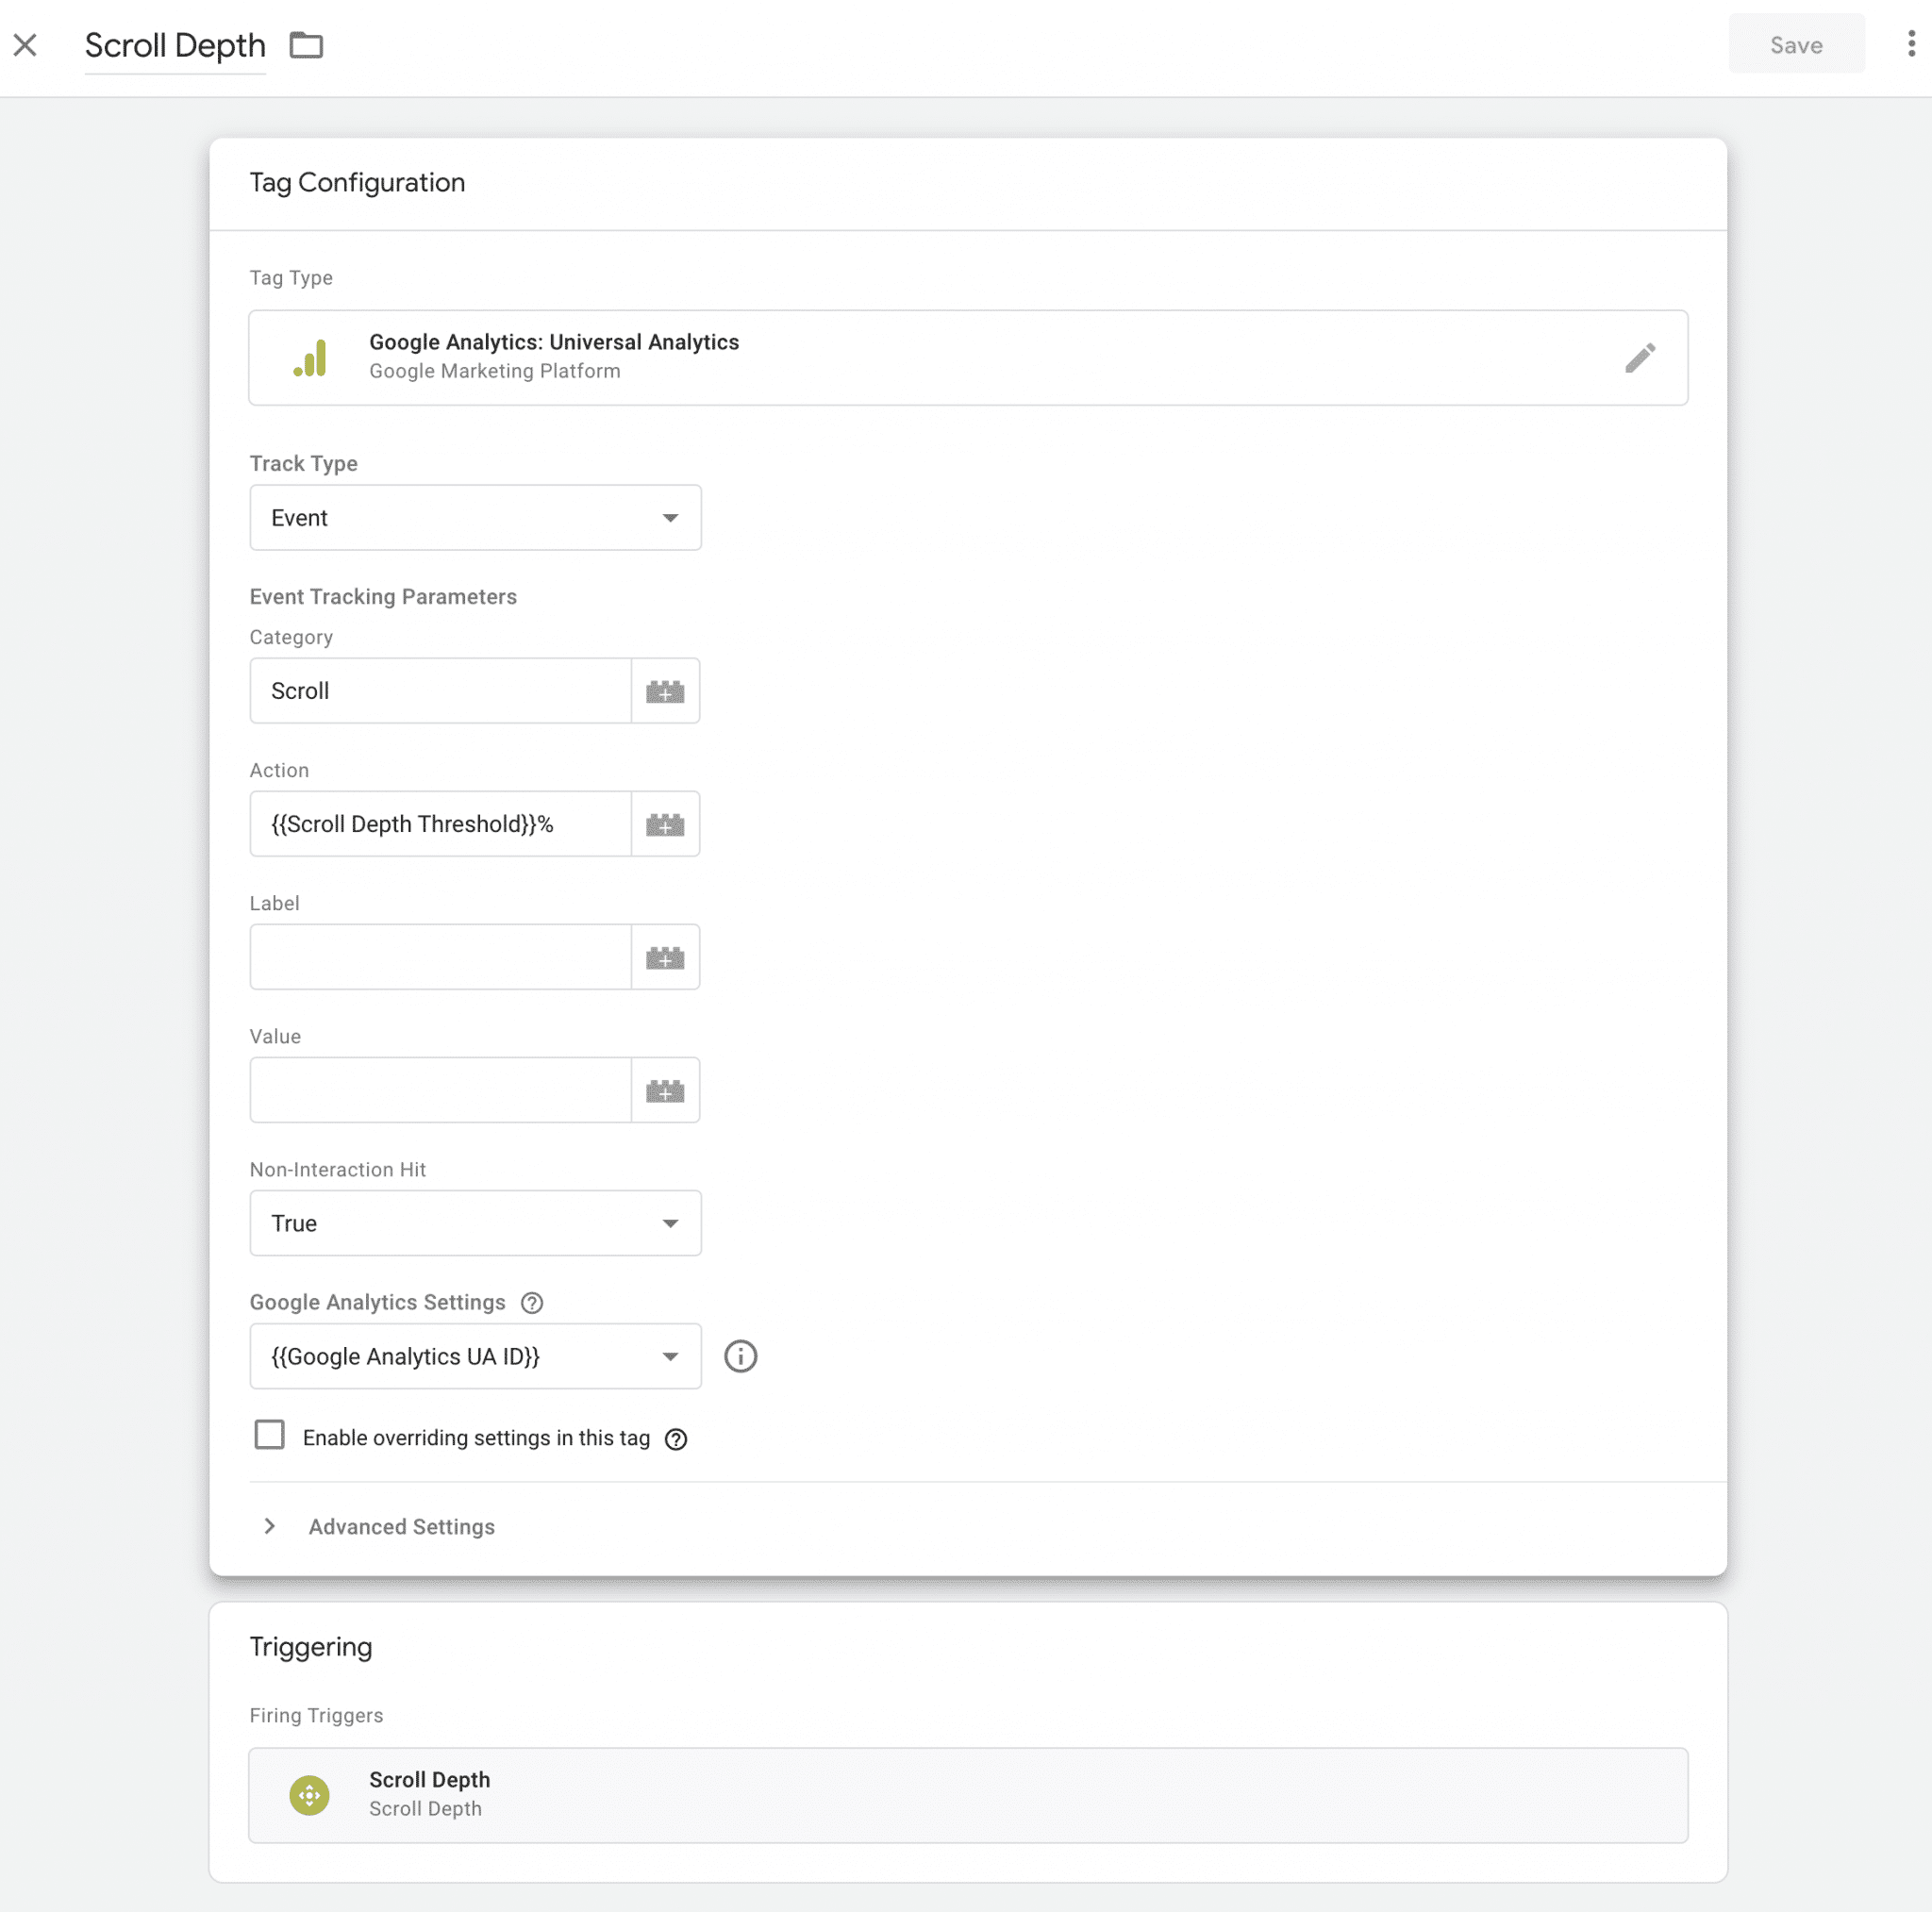
It is all fairly self explanatory. This tag essentially creates a Google Analytics event when the tag is triggered. You can call the category anything you like, but I always tend to use descriptive names wherever possible to help other users understand each piece of the jigsaw.
An important consideration on this particular set up screen is the ‘Non-Interaction Hit’, which needs to be set to true. This ensures that your bounce rate data remains accurate.
The last step in setting up the tag is to specify the triggering. You will therefore need to create a new trigger.
Create Trigger
You only want the scroll events to be created once the user has reached specified points on a page. This is controlled in the trigger configuration:
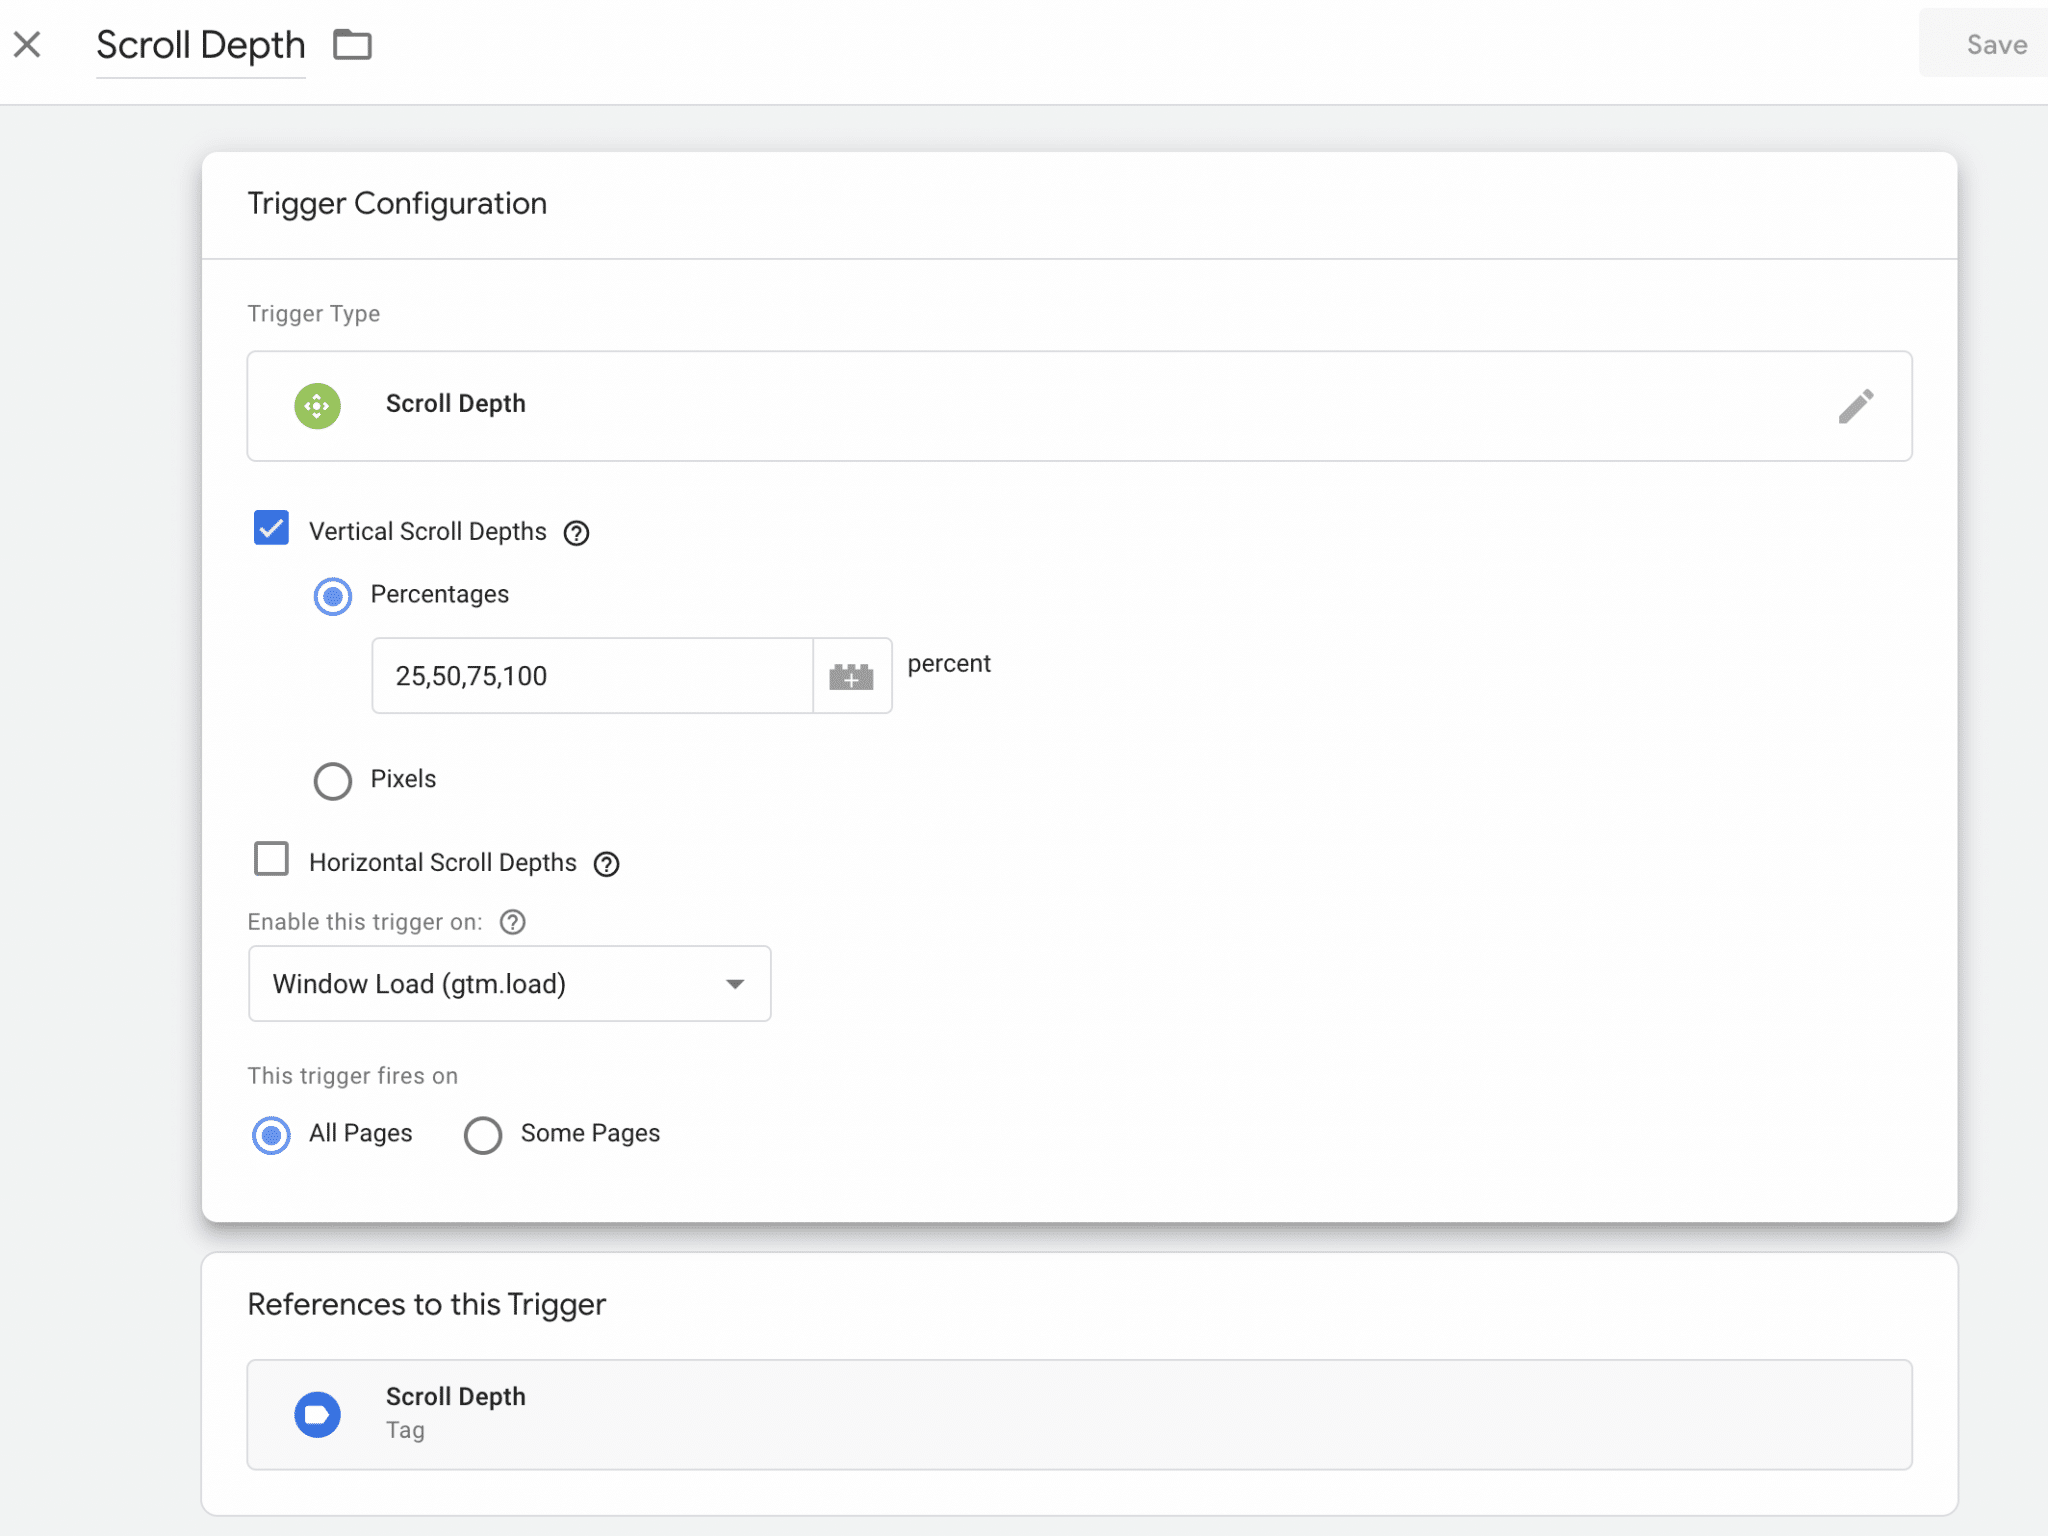
‘Scroll Depth’ is actually a built in trigger which you can find in the ‘User Engagement’ section of built in triggers. You can choose between percentage or pixels. In most cases, you should choose percentages as that will accommodate all screen sizes and is more flexible.
In the example above, I have chosen to trigger an event each time the user scrolls 25% down the page. You can ultimately choose as many points as you like, but I find this a good compromise that gives you a good picture of how far down the page users are scrolling without creating a tsunami of events in Google Analytics.
If you want to analyse all pages across your site, you should select ‘All Pages’ from the option at the bottom, but you do have the ability to only analyse certain pages. If you are only interested in analysing one page, or a handful of pages to compare, it is good practice to limit the tag to only fire on those pages.
Preview / Test
Once you have completed the steps above, you should have scroll depth tracking set up and ready to start collecting data. You can test that it is working using Google Tag Manager’s preview feature. If you launch that and load a page on your site (but do not scroll), you should see that tag but it isn’t fired:
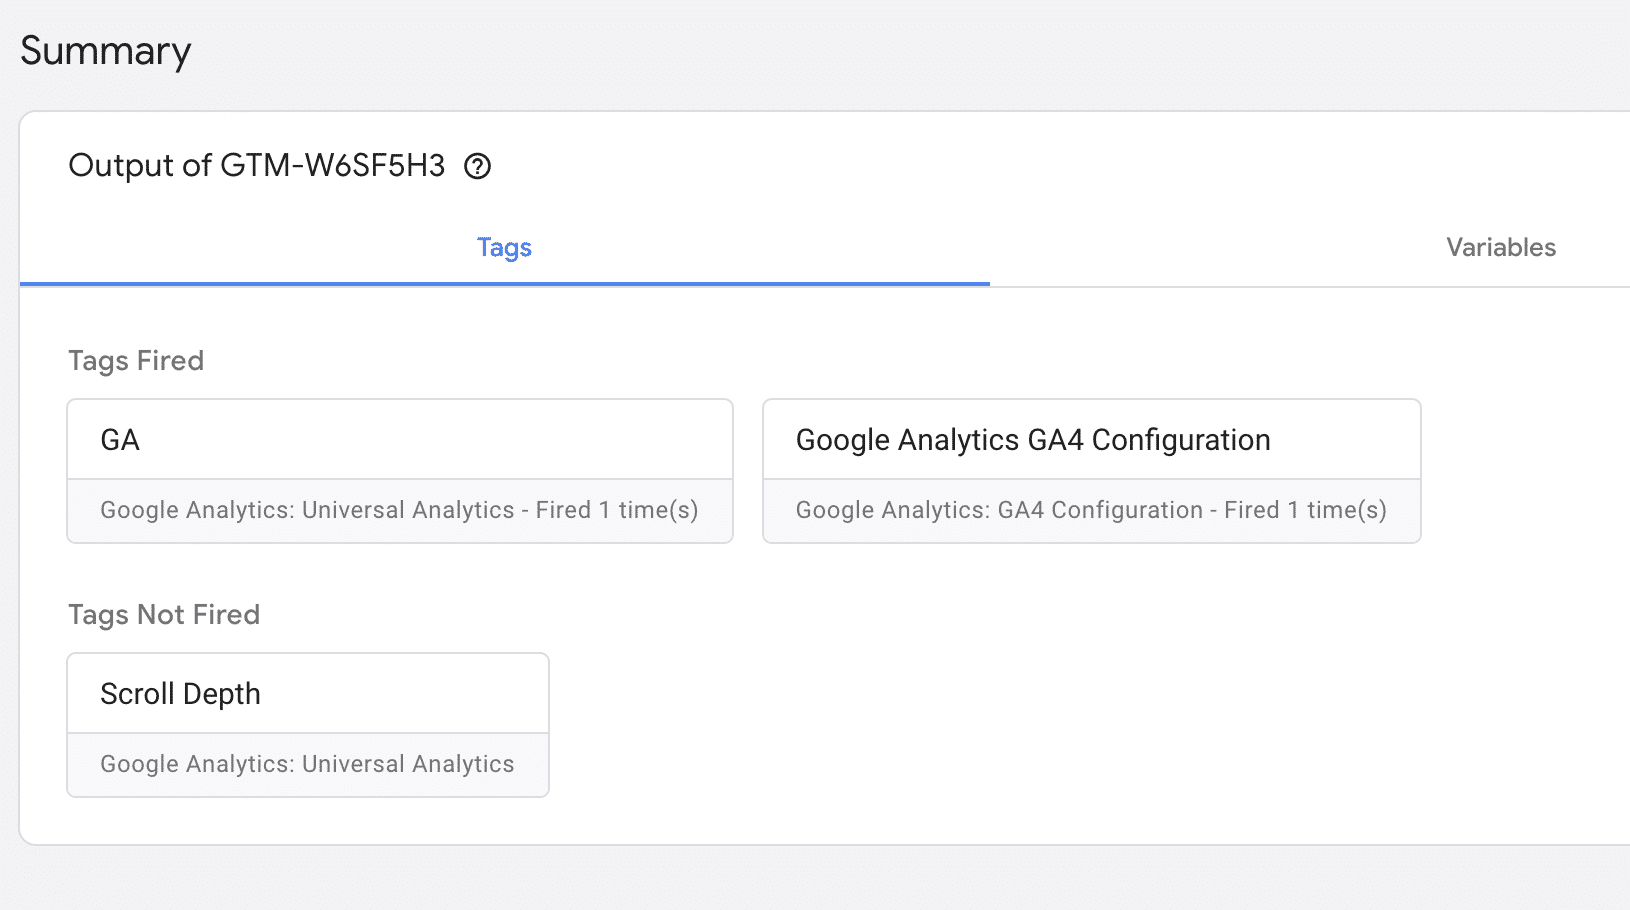
You should then scroll down the page to make sure that the tag is fired. I scrolled roughly half way down the page and can see that the tag is fired twice:

You can click on the tag to see the actual details of the tag – you should be seeing a scroll event being sent to Google Analytics.
Once you have published the container with the scroll depth tracking, you can also check that it is working in Google Analytics, as you should be able to see real-time events being fired:

As shown above, all the scroll events are recorded under the ‘Scroll’ event category and the event action shows the percentage scrolled on the page. If you can see that, you are all set.
Analysis
I would suggest turning your attention to something else for a few days in order to allow the data to build up as that will give you a more accurate picture of how users are engaging with your content. If you have very high levels of traffic, you will obviously be more confident in the data in a shorter time frame, but it is a good idea to build up data from as many users as possible over a reasonable period of time, in order to include natural fluctuations such as weekends / public holidays.
Once you have let it run, there are several ways to analyse the data. Creating a custom report that shows scroll analysis is an obvious choice, but I personally prefer to use the ‘Pages’ report in the events reporting:
To be honest, the report you will see when first clicking on the ‘Pages’ option is not massively helpful. A more useful breakdown can be found but using a pivot table and then choosing to pivot by ‘Event Action’, using ‘Unique Events’ as the metric. This produces a table that shows you the performance of individual pages:
![]()
If you have lots of other events firing on these pages, you may want to filter those out. A simple way is to create a filter that only shows events that include ‘%’. Equally, you may wish to only look at blog posts, for example, so you can create a filter to strip out everything else.
A table such as that above is excellent for detailed analysis, but you sometimes want a bigger picture. Personally, I like to use Google Data Studio for this and you can use the scroll depth data to create charts that give you a quick snapshot of scroll depth performance, e.g. :

It is important to think about the data that you are looking at. My immediate reaction when looking at the Google Data Studio chart above would be panic – hardly anyone scrolls to the bottom of the page and our content must therefore be rubbish?!
The reality is that this chart was created to look at blog posts and our template has quite a lot of content after the blog post itself, especially on mobile. With our page layout, the 75% scroll depth almost always indicates that the user has scrolled to the bottom of the blog post – they simply didn’t scroll past the Disqus panel or footer. I am therefore only really interested in the drop off between 25% and 75%.
The Ultimate Measure Of Web Traffic Quality?
I hope that this post introduces you to another traffic quality measure and helps you set it up if you are interested in exploring further.
Do I think it is the best measure for assessing the quality of traffic? No, I don’t. I think it is another metric that is interesting and there are arguments that it is better than the more common user engagement signals, but I would encourage you to look at as many metrics as possible rather than relying on one single data point. It is also potentially flawed – someone scrolling quickly to the bottom of a page without actually reading anything is hardly an engaged visitor. This is where a combination of time on page and scroll depth can be very revealing. You must also consider the design of your pages – it is perfectly possible for a user to read all the meaningful content without actually scrolling to the bottom on the page.
Have a play with it and see whether you think it is helpful or just another set of data that you don’t really use…