It is quite common for Google Display Network (GDN) campaigns to perform differently to Search Network campaigns and for this reason they can often have very different objectives. But which metrics should we be looking at when analysing the performance of display campaigns? In this blog post, we explore some of the useful stats available within Google Ads.
Conversions and conversion rate
Like with every Google Ads campaign, you can get a good indication of how well a GDN campaign is performing by looking at conversions. If the campaign is generating a healthy number of conversions at a good conversion rate or cost per conversion, relative to your other campaigns and business goals, then you can safely say they are doing well.
However, if your GDN campaign has been created for brand awareness you may see that the campaign is generating a lot of impressions and clicks, but possibly few conversions. But this is OK, as high impressions is what you want for brand awareness, right?
Broadly, the answer is yes, as impressions are the number of times an ad is shown, however there are other metrics available within Google Ads to help advertisers be more confident that these impressions are “good” impressions…
Impressions, unique users, and unique cookies
“Impressions”, like for all types of campaign, is one of the main metrics to look at and is the total number of times the ad(s) is shown, whether it is “seen” or not.
However, unique users and unique cookies give an idea of how many people have actually seen the ads, and can be unearthed by selecting the correct columns under the reach metrics section:

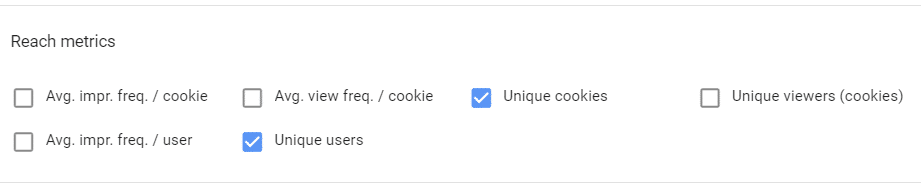
Unique users is the total number of people who saw an ad in your display or video campaigns over your selected time period:
This metric uses cross-device statistical models to measure the total reach of an ad by adjusting for cases when users may see the same ad on different devices or when multiple people share one device. – Google
Unique cookies is the total number of unique cookies that were exposed to an ad over your chosen time period. This differs from unique users, because if, for example, an ad is shown twice on a single device, it’s one unique cookie. This could apply even if multiple people use the device. Also, a single person may count as multiple cookies if they use multiple devices.
Viewable impressions
“Viewable impr.” counts the total number of times an ad was “viewable”, which means that at least 50% of its area was visible on the page for at least 1 second for display network ads, and 2 seconds for video ads.
This is a really useful metric to look at because your ads might be getting a high number of impressions, but if none of them are viewable, then of course they are not going to get the clicks and conversions that you want them to.
Measurable impressions
Another metric to consider is “Measurable impr.”. Measurable impressions is the number of times your ad appeared in a location on a website or app that could be measured for viewability. This is because not all locations across the web can be assessed for viewability, so this metric can be useful to look into if you notice your campaign’s viewable rate is particularly low.
Display impression share (plus Display lost IS (rank) and Display lost IS (budget))
Again, to see these metrics simply add the columns to the table you are viewing, they can be found under competitive metrics in the modify columns section:
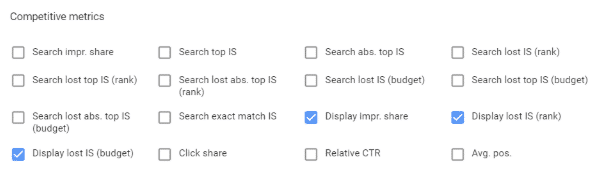
The impression share metric is the total number of impressions your ad received divided by the total Google estimates they could have received.
_x005F If your campaign has low display impression share (IS) then you can look at the “Display lost IS (rank)” and “Display lost IS (budget)” columns to try and ascertain whether you are losing impression share due to a rank/CPC issue or a budget issue. If your campaign is losing a lot of impression share because of rank, you may need to increase your maximum CPC/CPM bid or the quality of your campaign. On the other hand, if it’s due to budget, you may have to increase the campaign budget to allow your ads to get in front of more people.
Average session duration, bounce rate, and pages / session
If your display network campaigns are generating a lot of clicks but not many conversions, there are other metrics you can look at to see if the paid traffic is engaging with your site once it gets there.
If you have Google Analytics code on the website and have linked your Google Analytics account to your Google Ads account, you can see metrics such as bounce rate, pages / session, average session duration etc per campaign:

If you can see that the campaign has a low bounce rate and good average session duration and the users are viewing at least a few pages, you can see that the traffic is engaging with the site. If your campaign is seeing phenomenally high bounce rates (near 100%) then you may want to rethink the targeting options for your campaign or designing your image ads.